> ## Documentation Index
> Fetch the complete documentation index at: https://docs.myquery.ai/llms.txt
> Use this file to discover all available pages before exploring further.
# Dashboard Builder
> Build entire, multi-component dashboards from a single "plain English" prompt.
## Features
* **AI Planning Engine**: A two-step process where the AI first drafts a "Dashboard Plan" (choosing the best KPIs and visual hierarchy) before executing the queries.
* **Real-time Streaming**: Visualizations and metrics stream onto the canvas as they are generated, rather than waiting for the entire dashboard to finish.
* **Dynamic Gridstack Layout**: A fully interactive drag-and-drop interface that allows you to resize, rearrange, and pin components to a custom grid.
* **Multi-Turn Iteration**: Add specific charts, KPIs, or tables to an existing dashboard using follow-up conversational prompts.
## Usage
1. Start by choosing the specific database you want to analyze from the dropdown menu in the sidebar or top navigation bar.
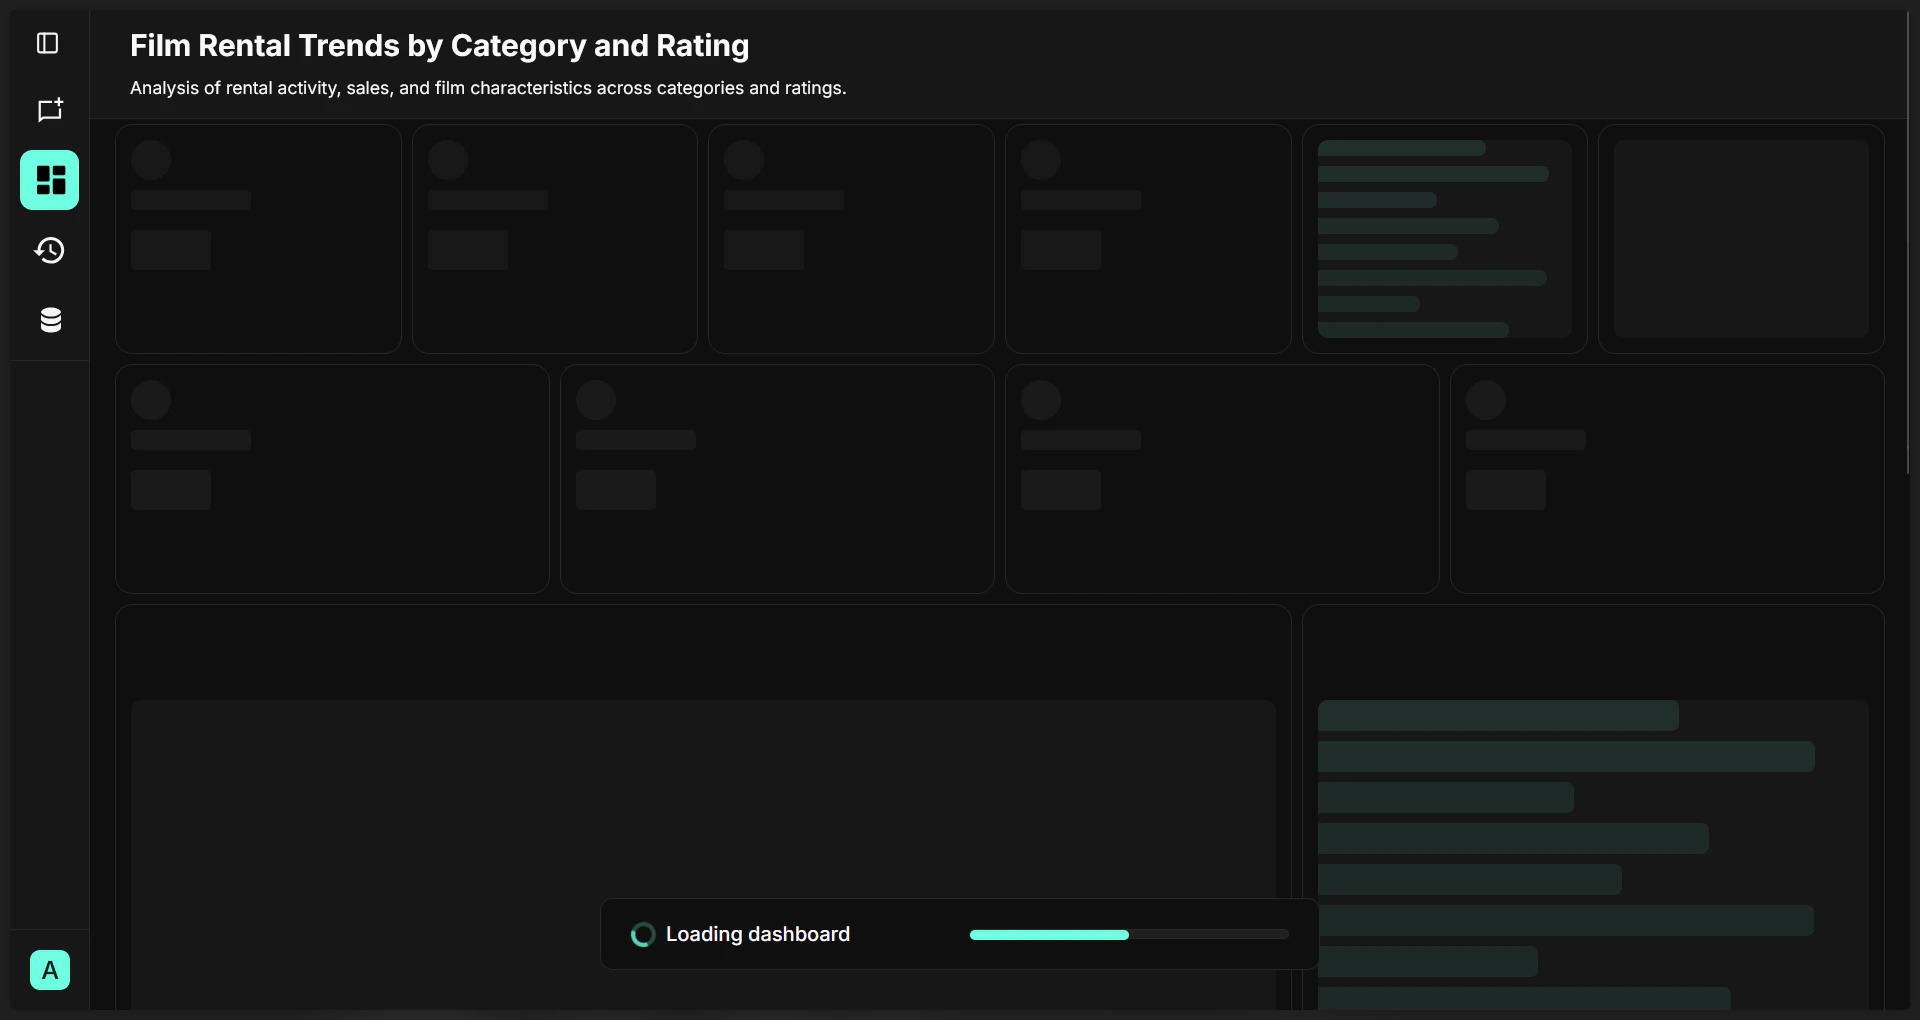
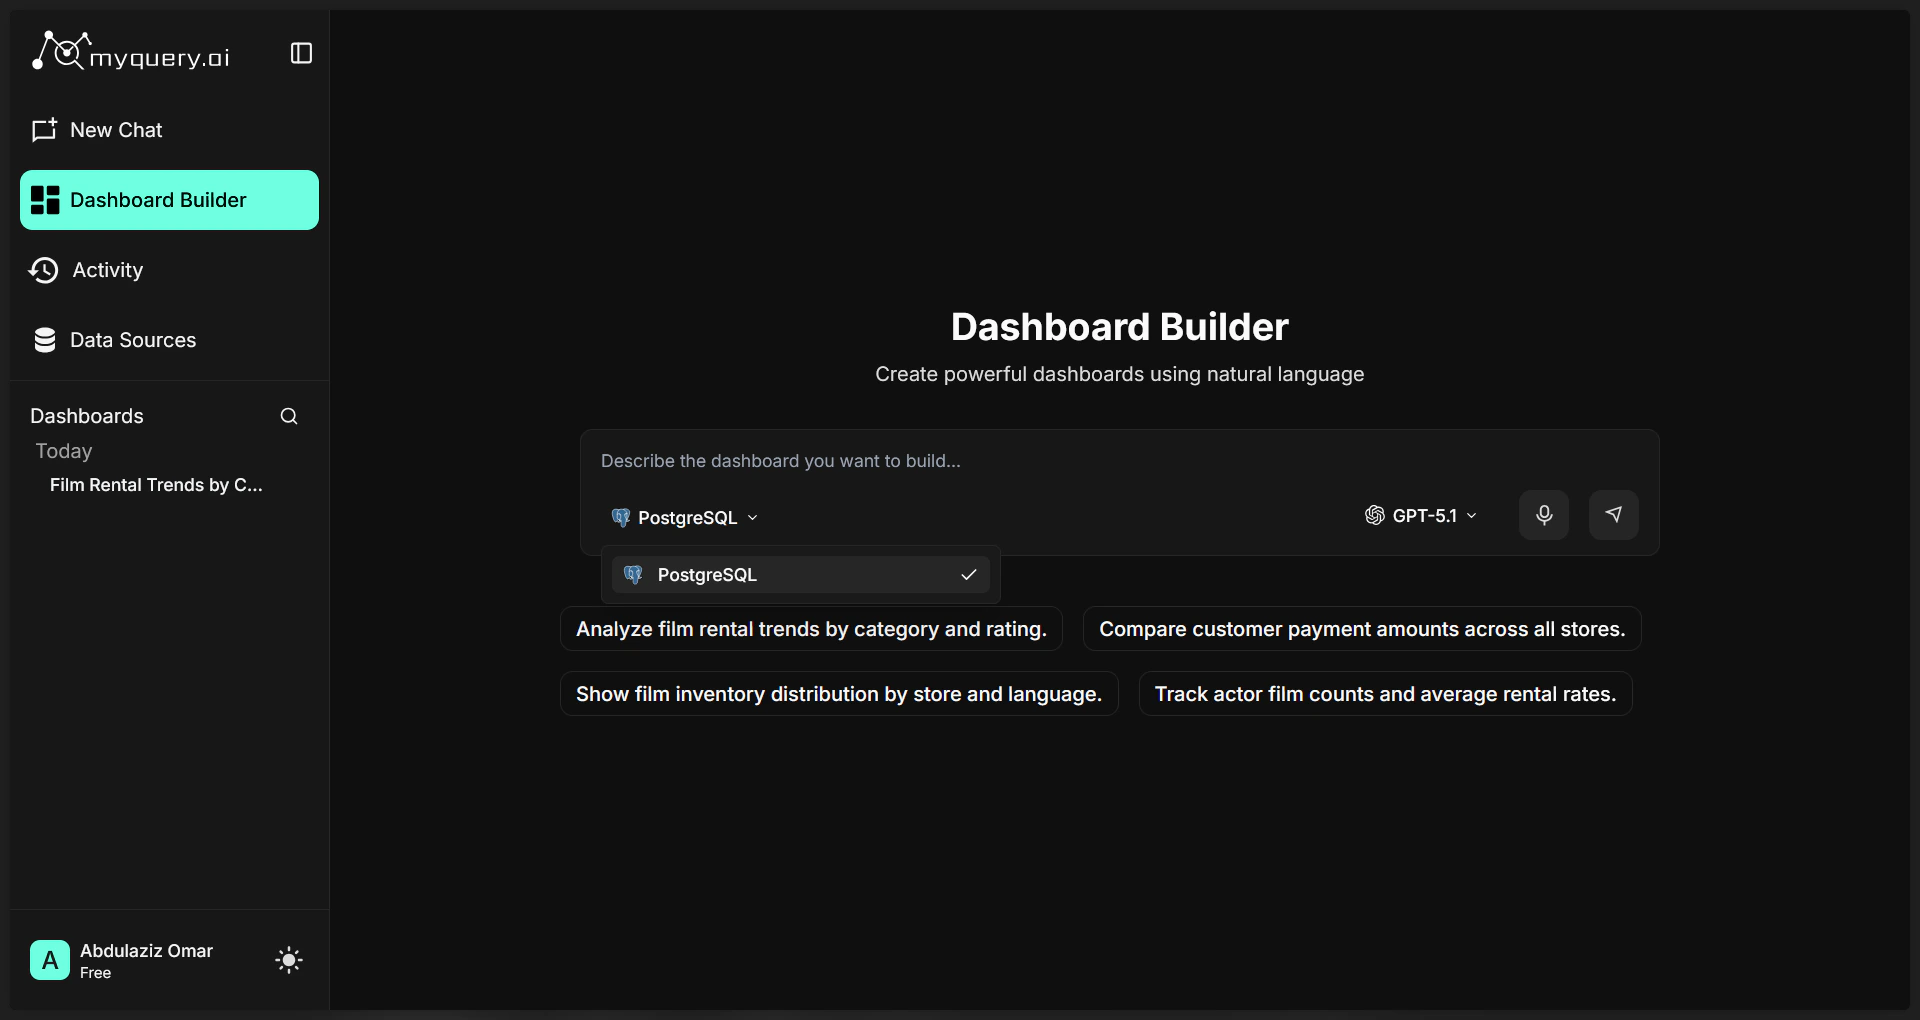 2. **Prompt the AI**: Enter a high-level question in the text area (e.g., *"Film Rental Trends by Category and Rating"*). The AI will automatically begin its **Planning Phase**. Watch as the AI drafts a dashboard structure. It will intelligently determine which KPIs, charts, and tables best answer your question before it executes any queries.
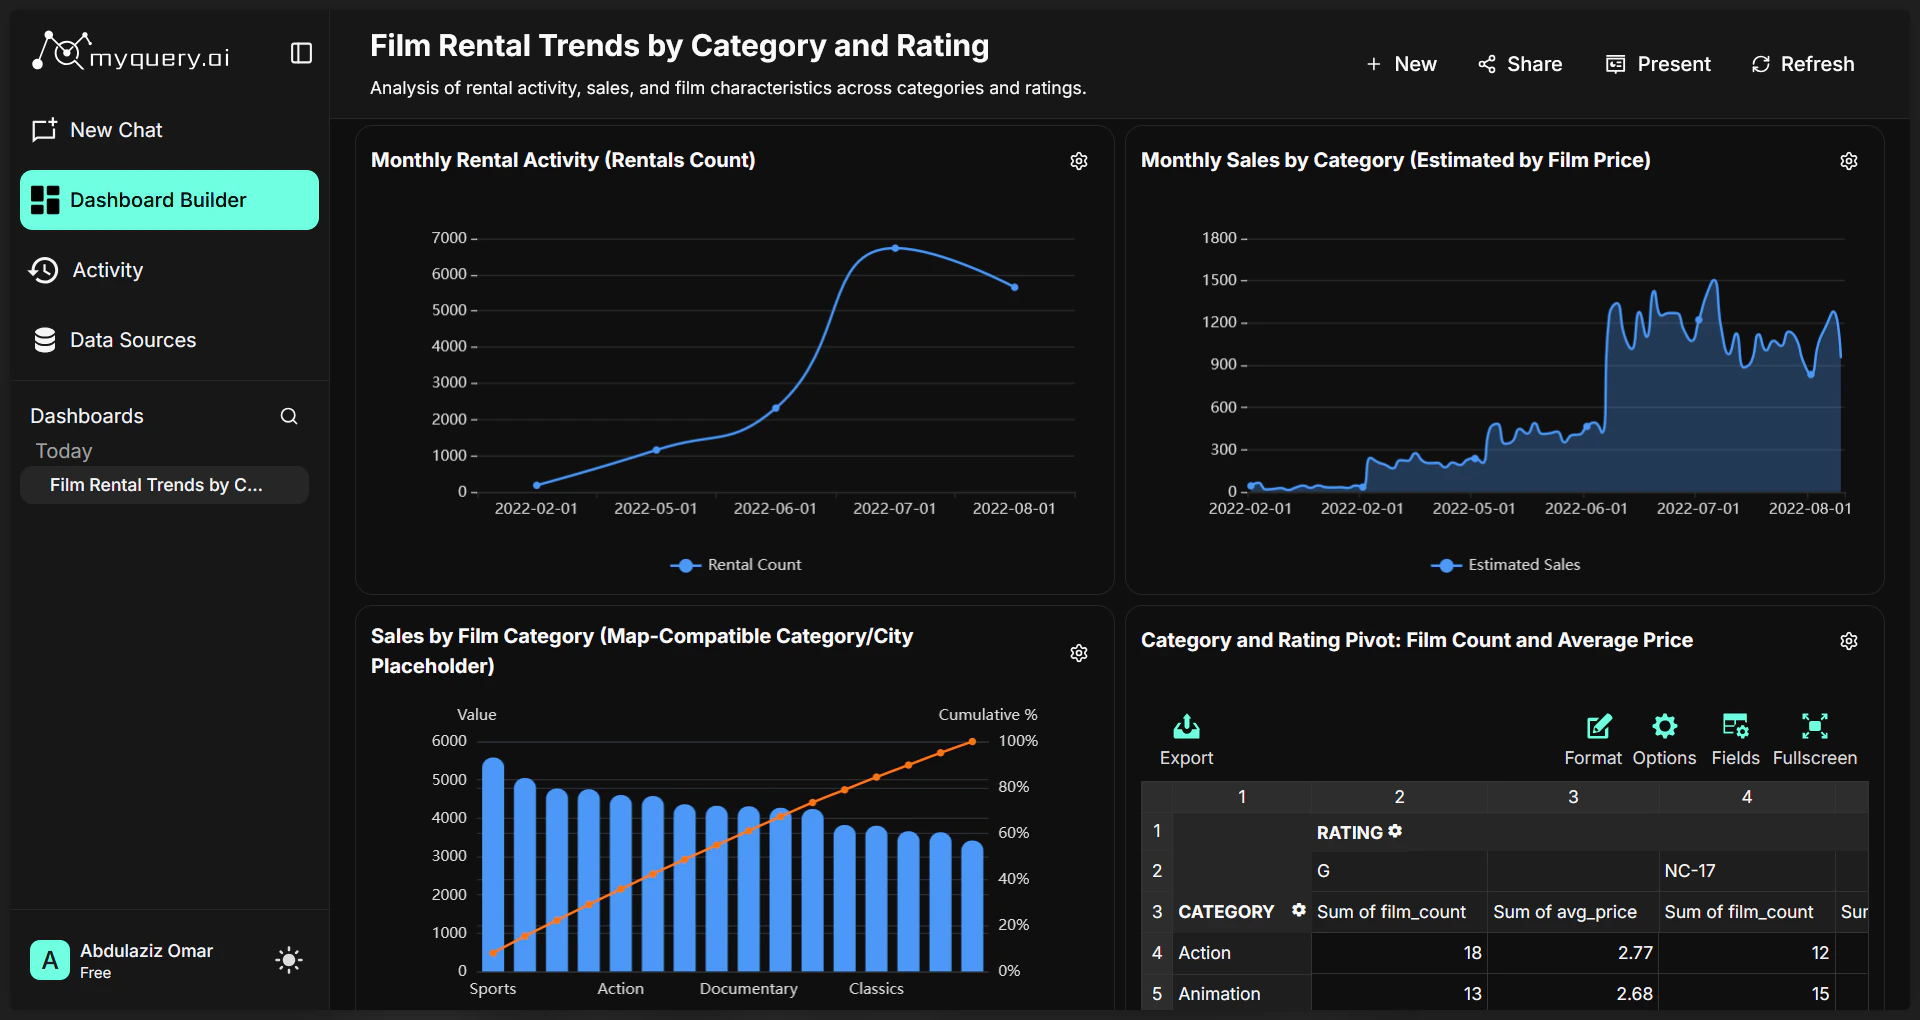
 3. The Result is shown:
 ## Actions
1. **Customize the Layout**:
* **Drag & Drop**: Move any chart or metric to your preferred position on the canvas.
* **Resize**: Use the handles on the bottom-right of any card to expand or shrink it.
* **Auto-Save**: The layout snaps to a grid and is automatically saved to your profile.
2. **Inspect and Edit**:
* **View SQL**: Double-click or click the "Inspect" icon on any chart to see the AI-generated SQL query.
* **Edit Content**: Manually update chart titles, descriptions, and Markdown annotations to add context for your team.
3. **Present Your Insights**:
* **Presentation Mode**: Toggle the "Theater" icon in the toolbar for a clean, full-screen view suitable for meetings.
* **Export**: Use the export menu to download your complete dashboard as a vectorized **PDF** or a multi-slide **PowerPoint (PPTX)** deck.
4. **Manage Your Work**: Access previously built dashboards from the "Saved Dashboards" list to refresh data or continue editing.
## Actions
1. **Customize the Layout**:
* **Drag & Drop**: Move any chart or metric to your preferred position on the canvas.
* **Resize**: Use the handles on the bottom-right of any card to expand or shrink it.
* **Auto-Save**: The layout snaps to a grid and is automatically saved to your profile.
2. **Inspect and Edit**:
* **View SQL**: Double-click or click the "Inspect" icon on any chart to see the AI-generated SQL query.
* **Edit Content**: Manually update chart titles, descriptions, and Markdown annotations to add context for your team.
3. **Present Your Insights**:
* **Presentation Mode**: Toggle the "Theater" icon in the toolbar for a clean, full-screen view suitable for meetings.
* **Export**: Use the export menu to download your complete dashboard as a vectorized **PDF** or a multi-slide **PowerPoint (PPTX)** deck.
4. **Manage Your Work**: Access previously built dashboards from the "Saved Dashboards" list to refresh data or continue editing.