1. Activity Overview
The page is divided into two primary sections to help you track different types of work:- Queries: A chronological log of every question asked to the AI and the resulting SQL execution.
- Dashboards: A history of dashboard creations and updates, showing who built what and when.
Performance Metrics
At the top of the page, you’ll find high-level statistics for your organization:- Total Queries: The count of all data requests made.
- Avg. Execution Time: How fast your database is responding to questions.
- Success Rate: The percentage of queries that were completed successfully without errors.
- Avg. Rows Returned: The typical size of the datasets your team is working with.
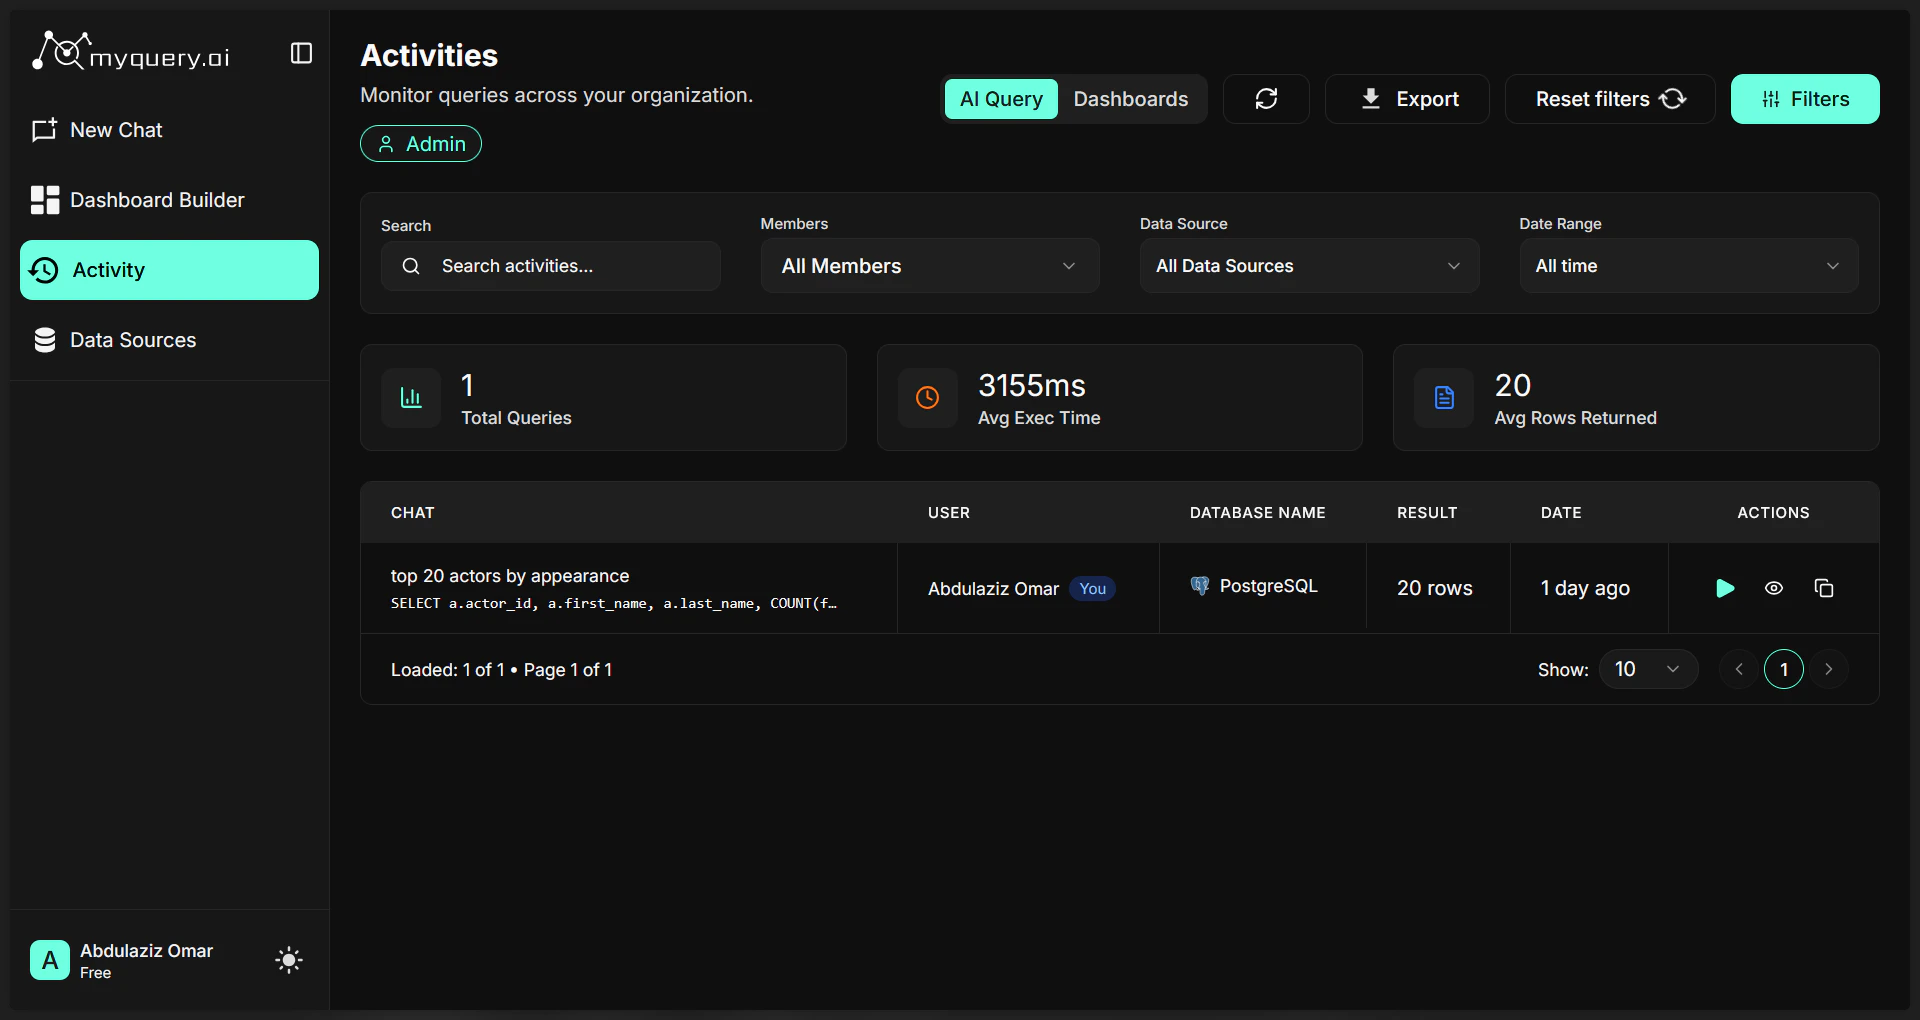
2. Searching & Filtering
With potentially thousands of activities, MyQuery provides powerful tools to find exactly what you’re looking for:- Keyword Search: Type any part of a question or a dashboard name into the search bar to find matching records.
- Date Range: Filter activities by timeframes like Today, This Week, Last Month, or use the Custom Range to select specific dates on a calendar.
- Team Member: (Admins only) Filter the feed to see the activity of a specific user.
- Data Source: Narrow down results to queries run against a specific database.
- Status Filter: Quickly find queries that Succeeded, Failed, or those that were Long-running (taking more time than usual).
3. Interacting with Past Queries
The Activity feed isn’t just a static list—it’s interactive:- View Details: Click on any query to see the full SQL logic, the exact time it was run, and the number of rows it returned.
- Re-run Query: Found an interesting insight from last week? Click the Play icon to execute that exact query again on the latest data.
- View Results: Instead of re-running, you can often view the Results Table or the Chart from the last time the query was executed.
- SQL Editor: For advanced users, you can view the generated SQL, make manual tweaks, and run the modified version to refine your results.
- Copy Logic: Quickly copy the SQL code to your clipboard to use in other reporting tools.

4. Understanding the Status Icons
- Green Check (Success): The query ran perfectly and returned data.
- Red “X” (Failed): The query encountered an error (e.g., a database connection issue or a syntax error).
- Yellow Clock (Long-running): The query was successful but took longer than the performance threshold to complete.